Updated Retention report — segment your audience with superb precision
موارد التسويق
The current Finteza update will help those who need to target narrow audience segments, not just general user experience scenarios. The new Retention report functionality allows building fundamentally new hypotheses affecting the traffic and income of your projects. In addition, we took into account the feedback for the previous version and made the report interface and design more convenient and intuitive.
The key feature of the updated report is the multi-stage conditions for Start and Tracked Events, which can be additionally filtered. Now the Retention report in Finteza provides maximum detail of what is happening on your site. Combine conditions and actions, include and exclude segments and create reports for any user group.
Advanced event settings
1. Now you can create combinations of conditions with the "OR" and "AND" parameters. The number and sequence of conditions are not limited.
- To use the "OR" condition, select multiple events at once when you first add them. This means that the report will include users who have completed either the first or second action.

Note that you can both include and exclude events. In our example, if we click the Include button, the description of the Start Event will look like this:

If you want to add one or more events with the "OR" condition, click on a desired condition or a list of conditions and add one more event from the list that appears:

- If you want to add one or more events with the “AND” condition, click the Add Event button. In this case, only those users who strictly meet all the listed conditions are included in the report.

2. Events can be refined with filters. This segments the audience even more accurately. Filters allow distributing users by technical characteristics (devices, operating systems, browsers, geography, etc.), sources, traffic quality, visited pages and other parameters.
- If you need to apply a filter to all events at the same time, use the Add filter button at the top of the block
- If you want to apply filters to only one of the events, use the buttons next to them

Thus, you can select any segment of your users.
Only new users
Another new setting provides the ability to select "new" users only. This means that only those users whose first Start Event fell within the report period are included in the report. Keep in mind that if you installed the Finteza counter on your site two hours ago, all users are considered “new”. In this case, it will take time to collect statistically significant data.

This setting is useful if you want to track the behavior of people who visited your website for the first time, rather than of your core audience. This way you can track the effect of changes on the site or in marketing activities in the context of existing users and newcomers.
Only First Match for Start and Tracked Event
Sometimes, we need data on the first event only rather than on all of them in order to get the accurate picture. Suppose that we have an application with free content and additional paid services - a mobile game or a music streaming service. We want to know how well our app is monetized. Normally, a report shows how users make purchases after the Start Event (for example, after a registration). Retention shows how the purchases of a certain group of customers are distributed over time, thus fulfilling its main function.
But what if we need to evaluate the ongoing work with the audience aimed at turning "free" users into "paid" ones? Is it possible to understand how much time it takes for users to make their first purchase? We cannot rely on the "regular" report here since it includes all the purchases made by the user. If some of the clients performed several Tracked Events within the reporting period, the obtained data will be inaccurate. This in turn may cause incorrect hypotheses and resources wasted on solving non-existent issues.
The most viable solution here is to take only the first tracked event into account. If we check Only First Match for Tracked Event (in our case, for purchases), Finteza ignores repeated events considering only the very first of them. This way you can track how long it took your users to decide to switch to paid content. This will help you evaluate how effectively you encourage your audience to take a targeted action and track changes in user behavior after adjustments.
In case of the Start Event, the checkbox works in the same way, albeit in the opposite direction. Suppose that we have a marketplace. Users visit it to choose goods, ask the price, compare positions, and so on. If the offer suits them, they register and buy something. How can we understand how much time it takes for a user to become a client? Users can visit the marketplace daily for months, or even years, or they can buy something immediately when visiting the site for the first time. If we take into account all user visits as a Start Event, we will not see the real picture. So we need to find only the very first visit of a person. This is where the Only First Match checkbox comes to the rescue again. Finteza will discard unnecessary repeating events, and we will get a report that will clearly show how long it took for a client to perform the Tracked Event after the first visit.

Key periods
Now you can simultaneously study the overall picture for each day in reports or mark key periods that are traditionally used in analytics: one day from an event, two days, three, seven, fourteen, and so on. This feature is more of an aesthetic one. We have added it to make it easier to present and understand the data. Many recommendations and studies are based on such key periods, so it will be more convenient for you to work with business indicators or compare your statistics with generally accepted one.
Please note that the graph with key periods is available only for reports built by days, not by weeks or months.

An example of tasks you can solve with an updated report
Suppose that your online store had a Black Friday sale. In general, the picture is more than satisfactory - you have a large increase in new customers, and those users who visited the site on the days of the promotion made repeated purchases within a week. Repeating the promotion during Christmas seems a good idea. However, there is a small detail which is easy to miss. 50% of your clients speak English, 40% speak German and 10% speak French. It turns out that your content manager forgot to add the French-language landing page for the mobile version of the site. This means that some of the new clients (mobile users and French-speaking) simply did not know about the promotion.
This situation can be easily overlooked when the overall results are good. But the Retention report knows that you can do even better. Now you can apply filters to individual events or blocks on the entire Tracked Event or Start Event. Check the Only New Users option and add a segment of users from France who registered via a mobile device during the promotion period.
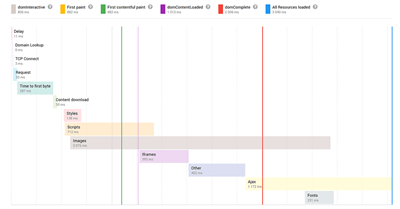
Similarly, you can track changes when they affect a small but important part of the audience. For example, the Lighthouse report advised to add a version for the visually impaired clients to the site. You need to separately study the user experience in it. Mark the pages you need, filter users and get comprehensive information.
With the latest update, the Finteza Retention report opens up the widest possibilities, which in most cases are technically inaccessible to analytical services. Install Finteza counters on your websites and applications to get real-time reliable statistics about everything that happens in your project. Our analytical service creates a solid base for strategic and operational decisions of any direction - from finance to UX. Check out Finteza — you might be ready to take your business to the next level.